All of our open source software tools are available on GitHub.
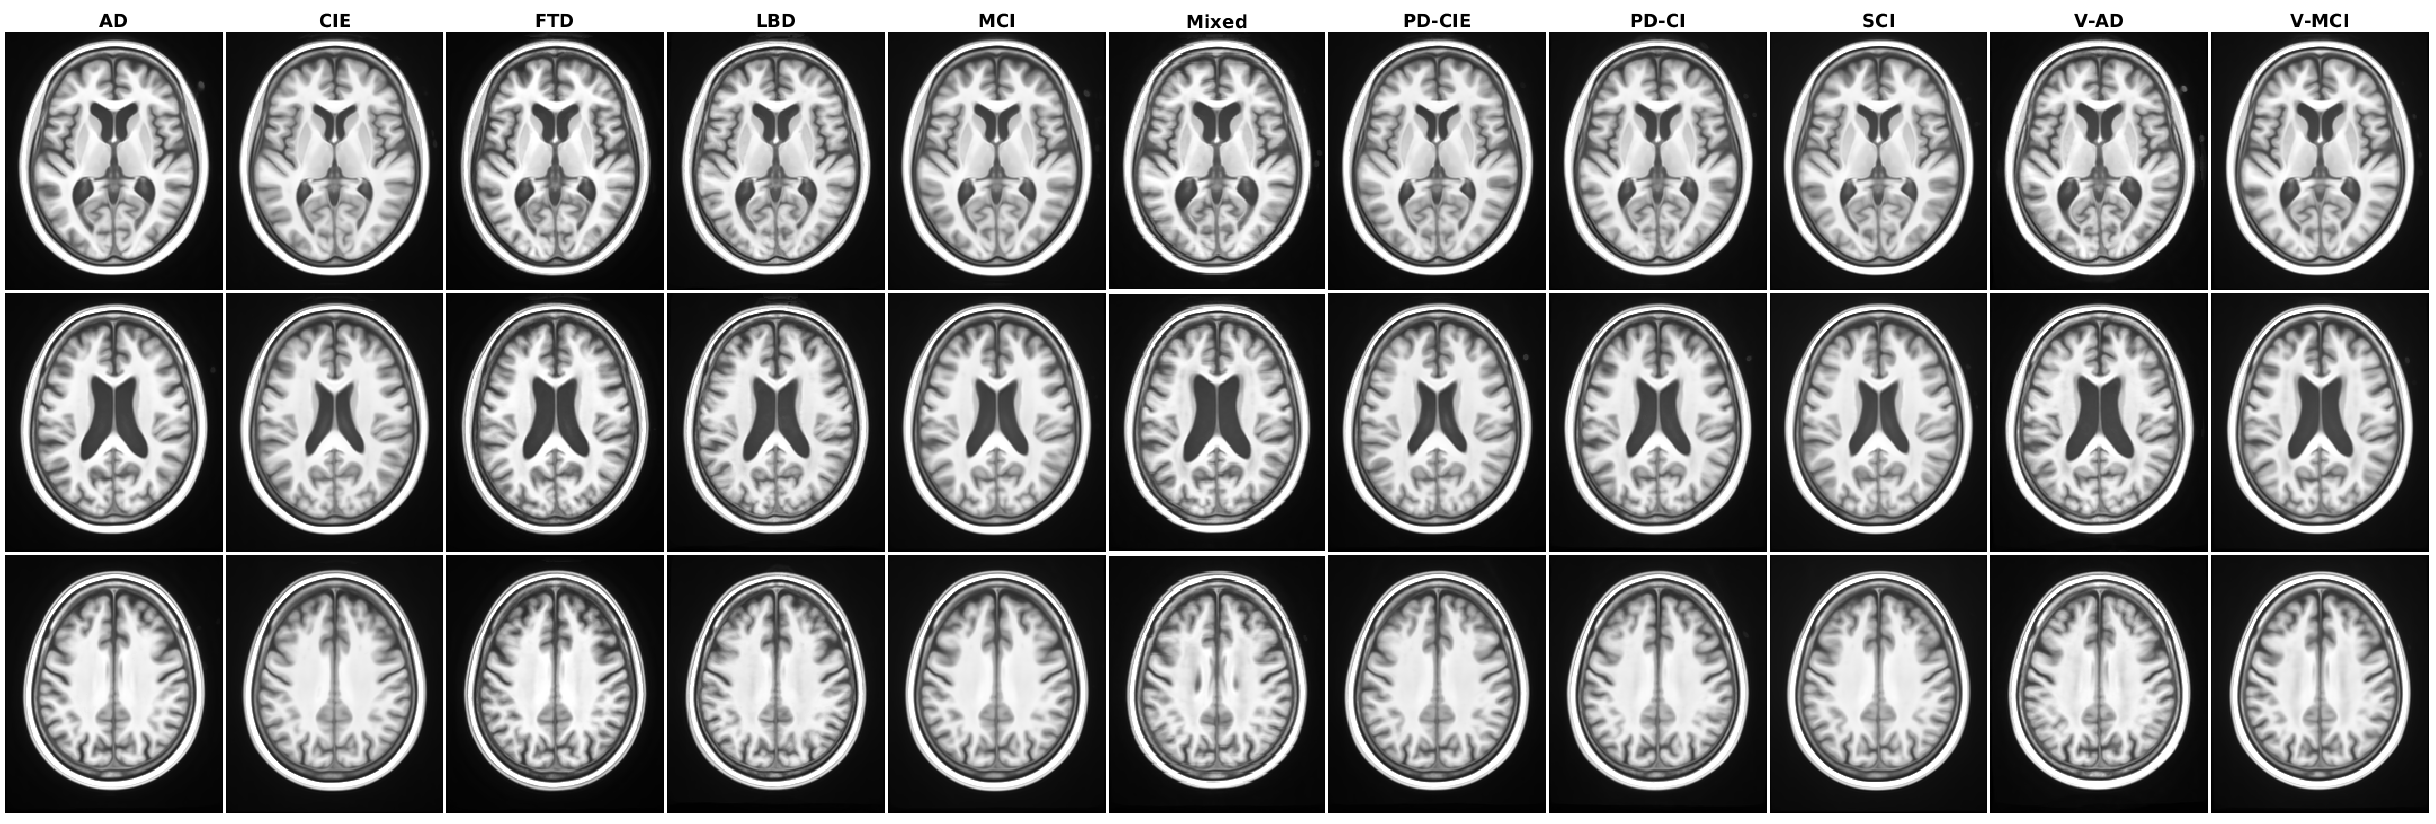
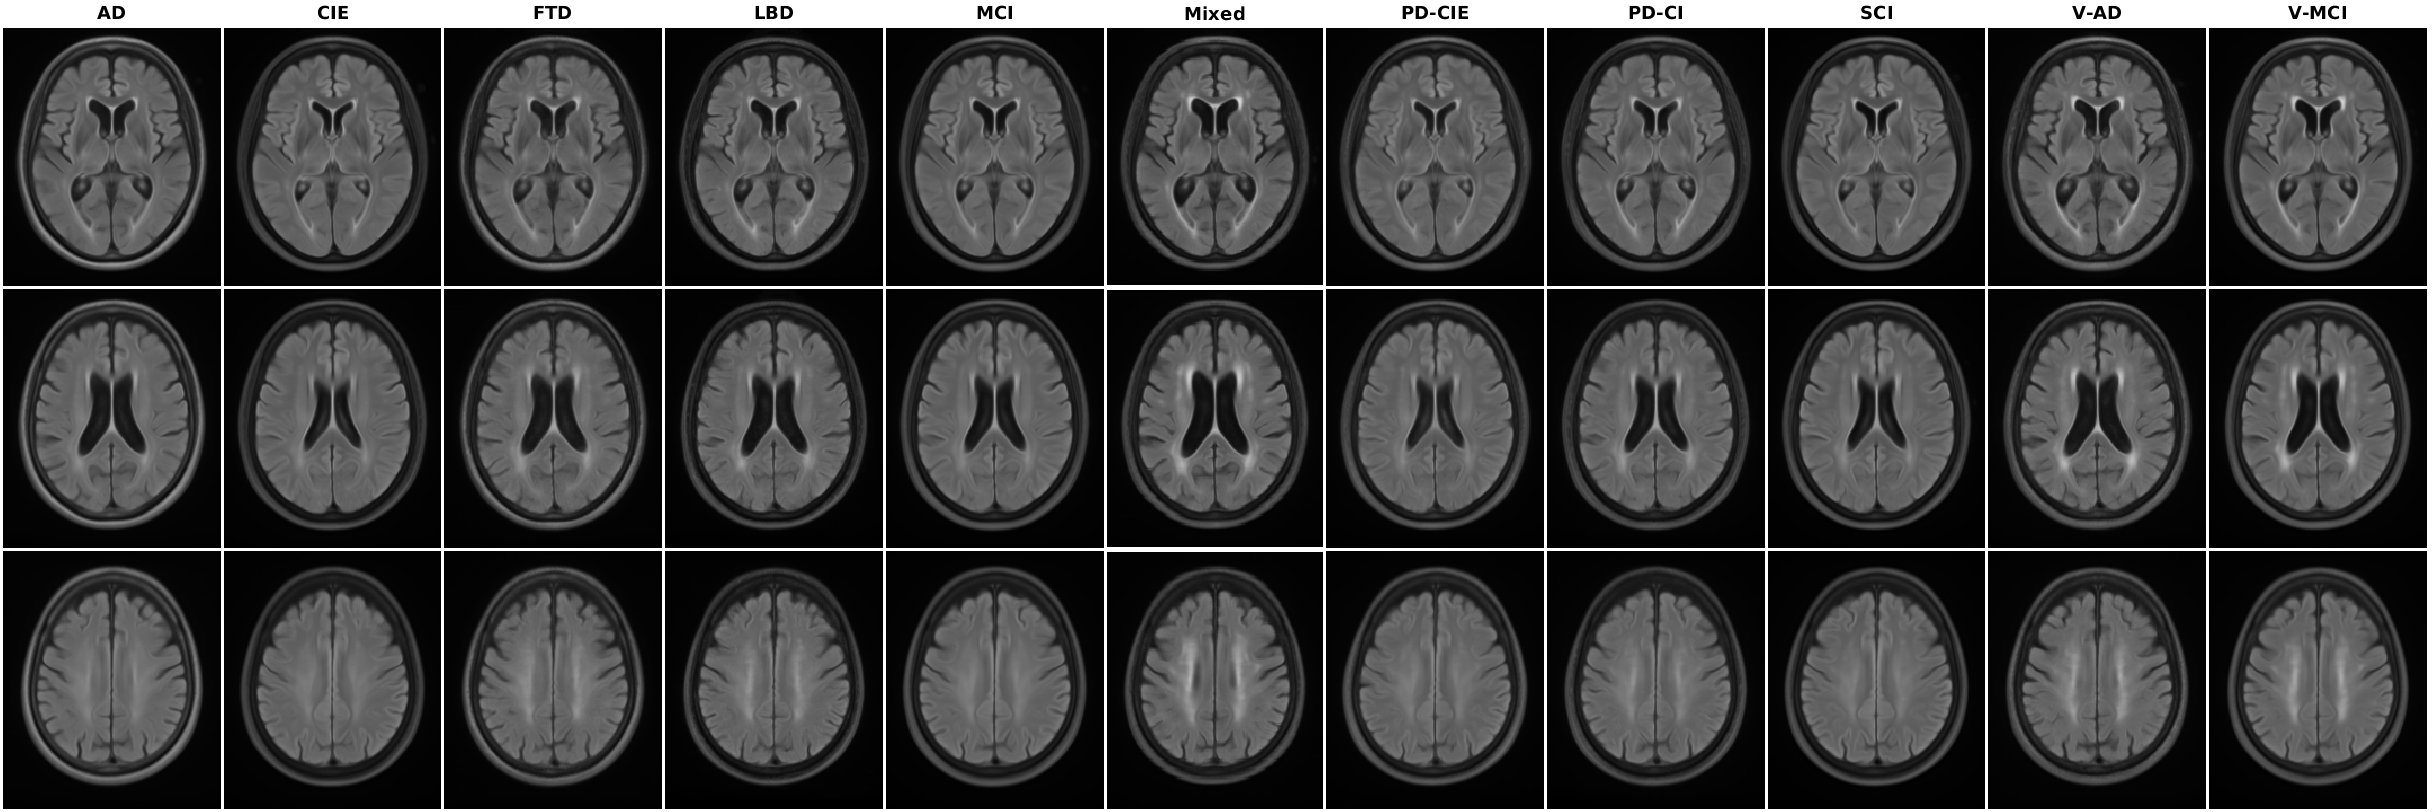
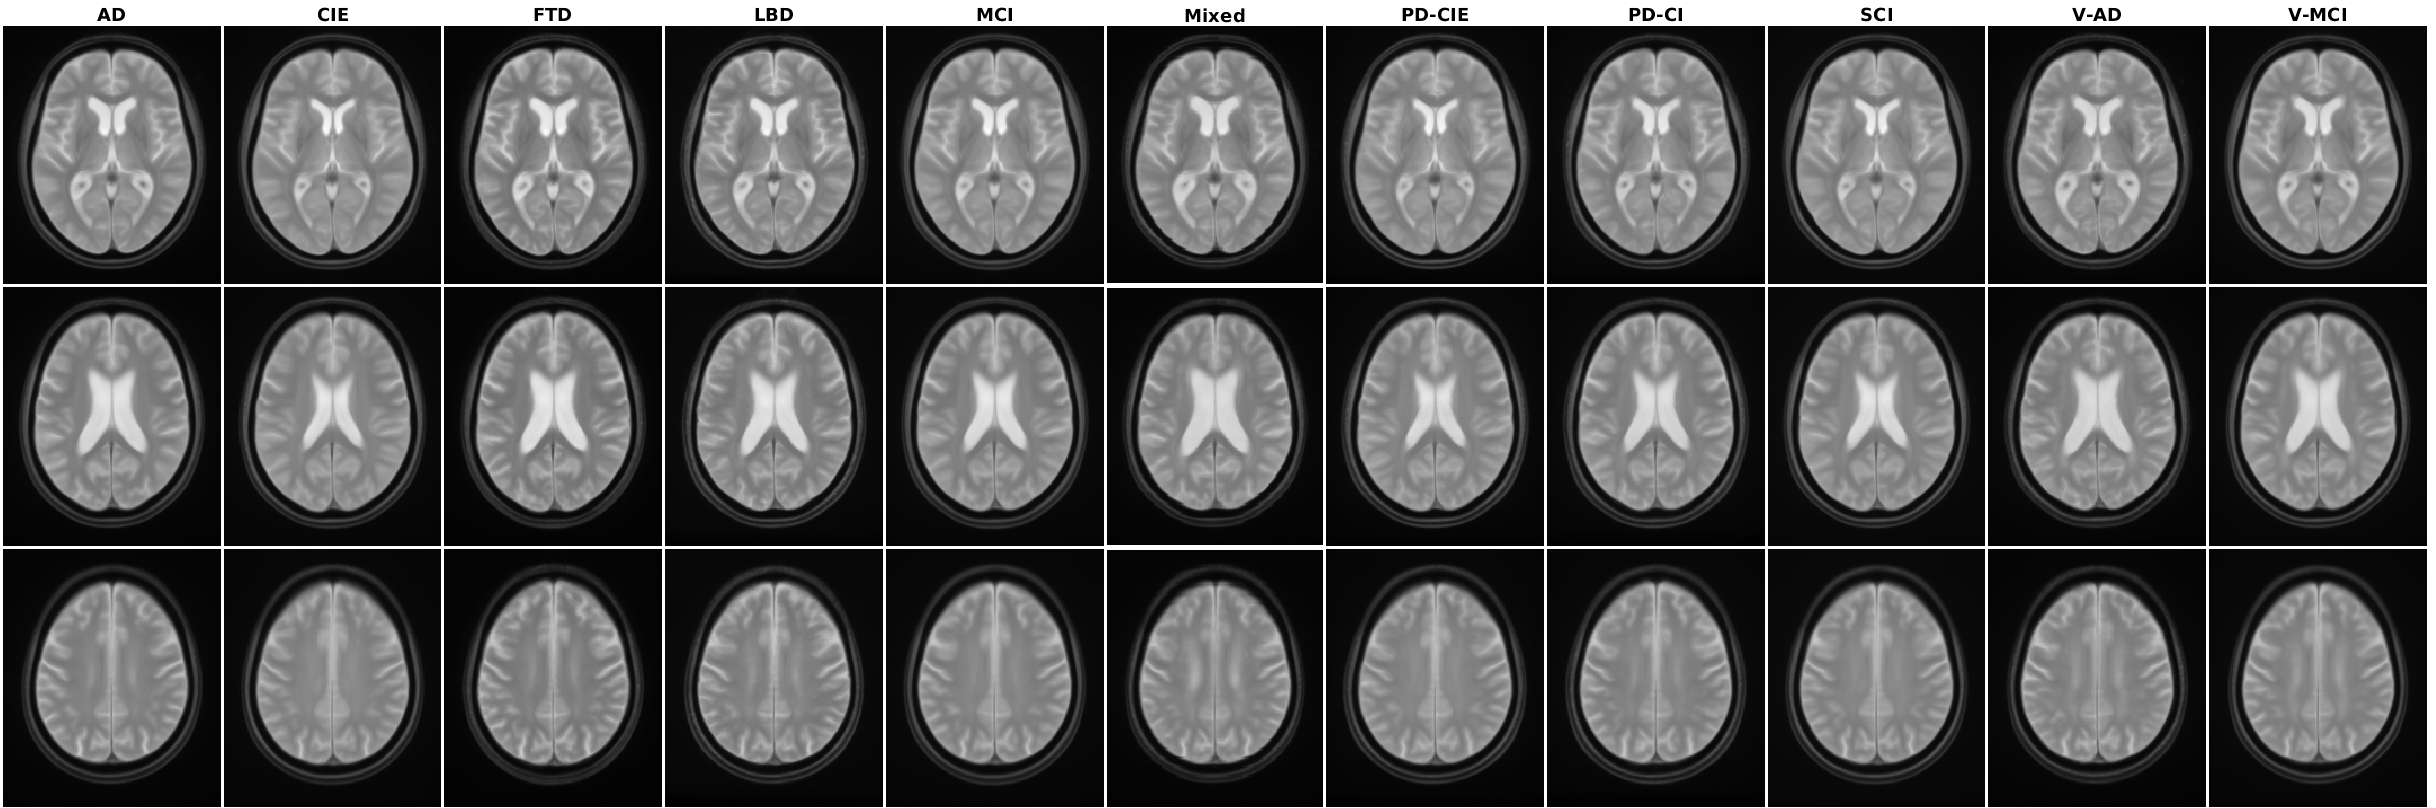
Standard templates are widely used in human neuroimaging processing pipelines to facilitate group-level analyses and comparisons across subjects/populations. Age appropriate and disease specific templates are therefore desirable not only to reflect the overall anatomical differences between the populations of interest and average young healthy adult brains, but also to reduce potential registration errors and biases when processing data from such populations.
Accurate anatomical atlases are important tools in neuroimaging research. They are widely used to estimate disease-specific changes and extract regional information on volumetric variations in clinical cohorts in comparison to healthy populations.
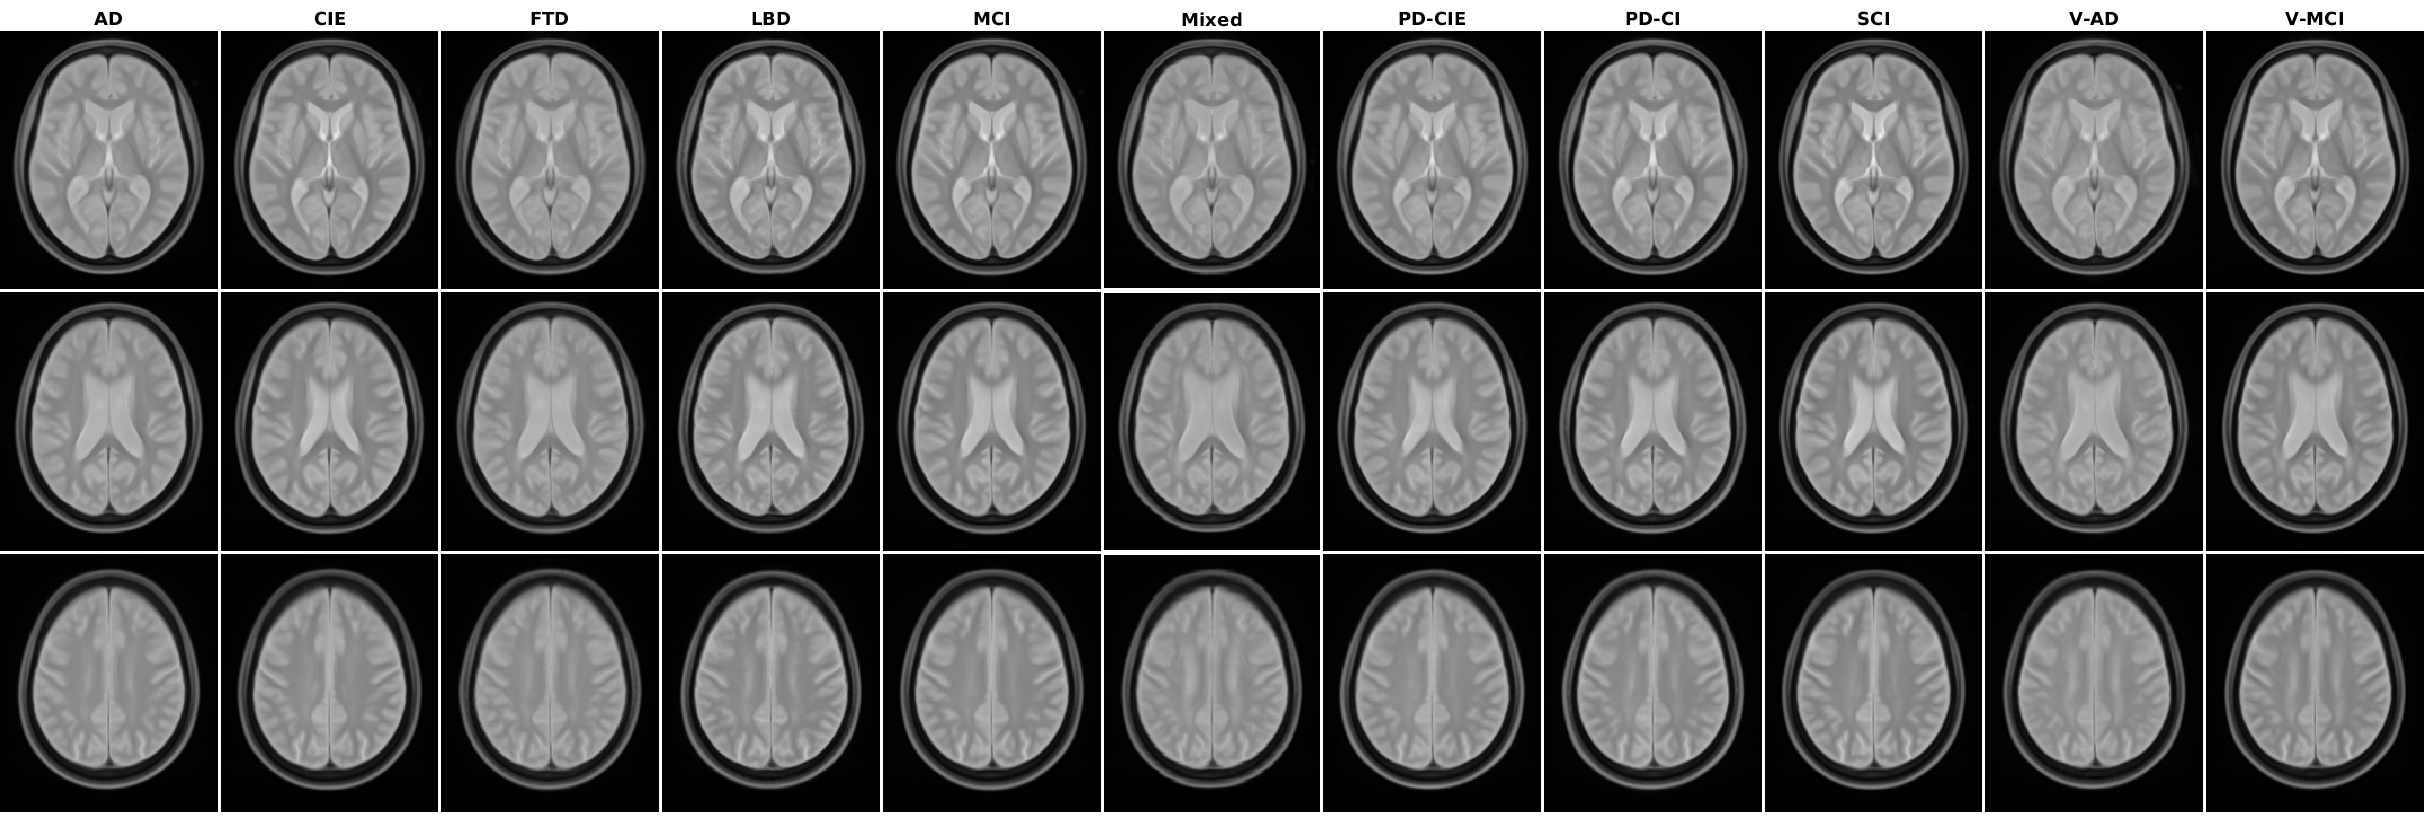
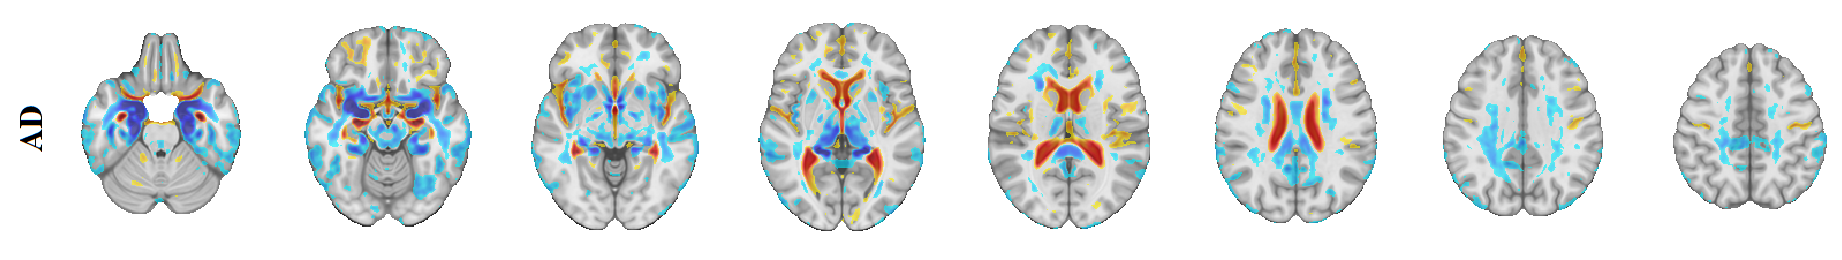
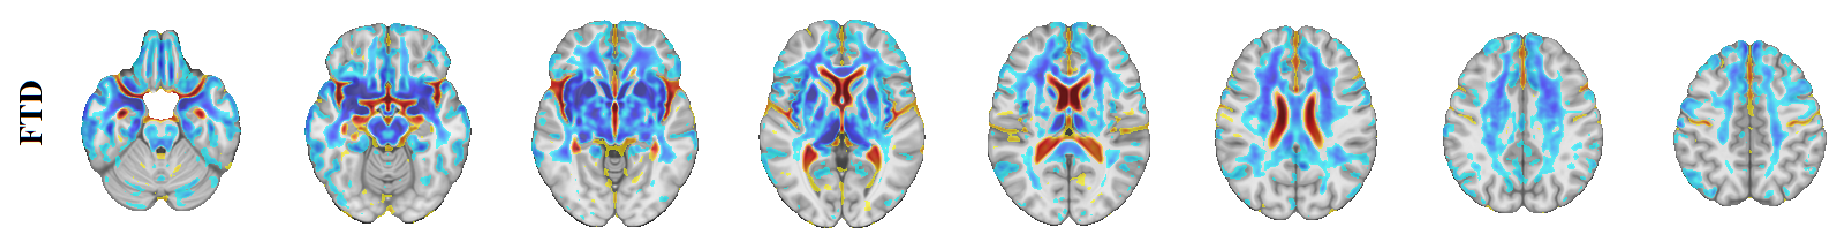
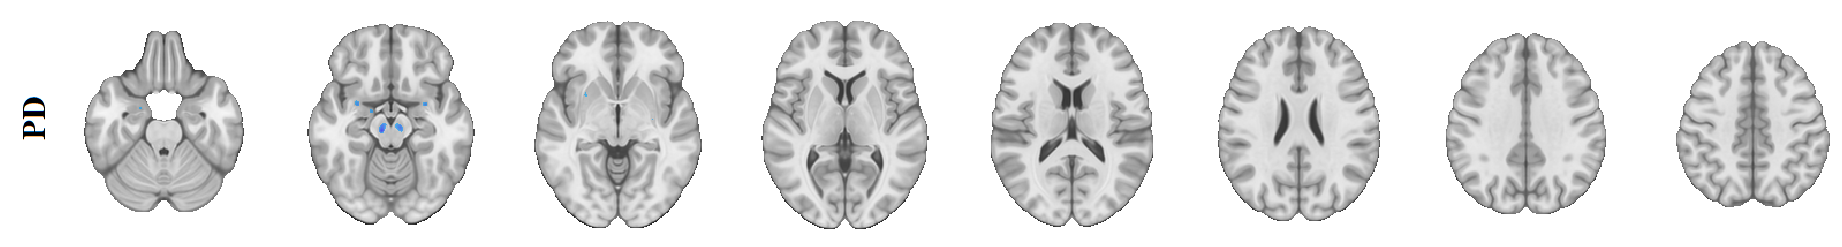
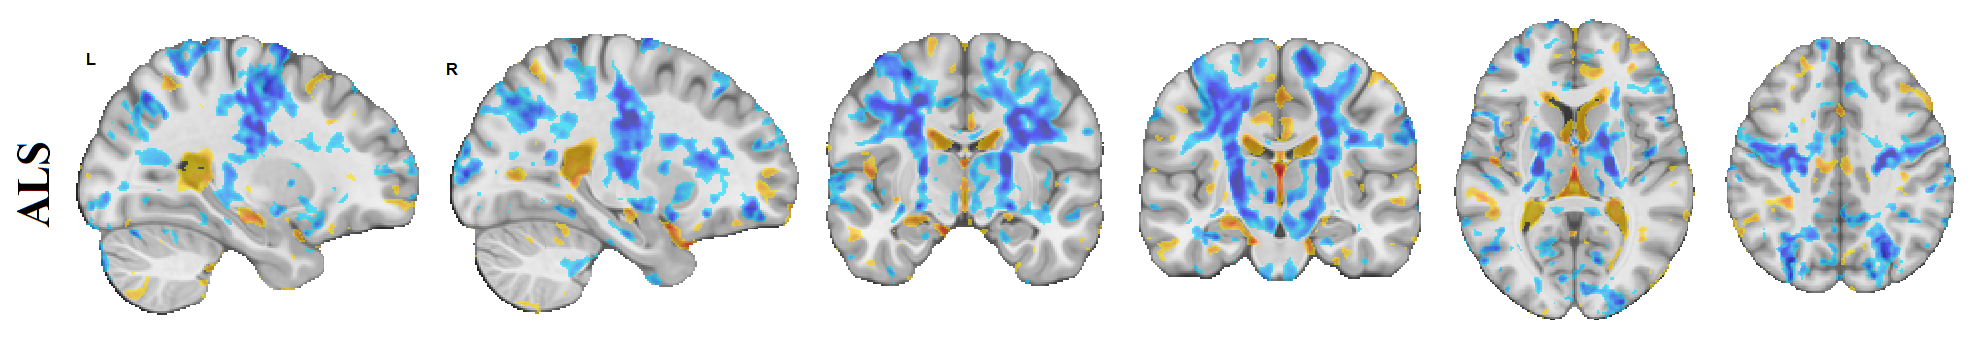
Deformation based morphometry (DBM) based t-statistics disease atrophy maps based on voxel-wise mixed effects models. The t-statistics maps reflect the local brain changes in patient cohorts, i.e. deviations of the patient DBM measures relative to the values expected in control groups. Positive values indicate areas that are significantly enlarged in the patients in comparison with the controls (e.g. in the sulci and ventricular regions), and negative values indicate areas of additional shrinkage (i.e. atrophy) in the patients.
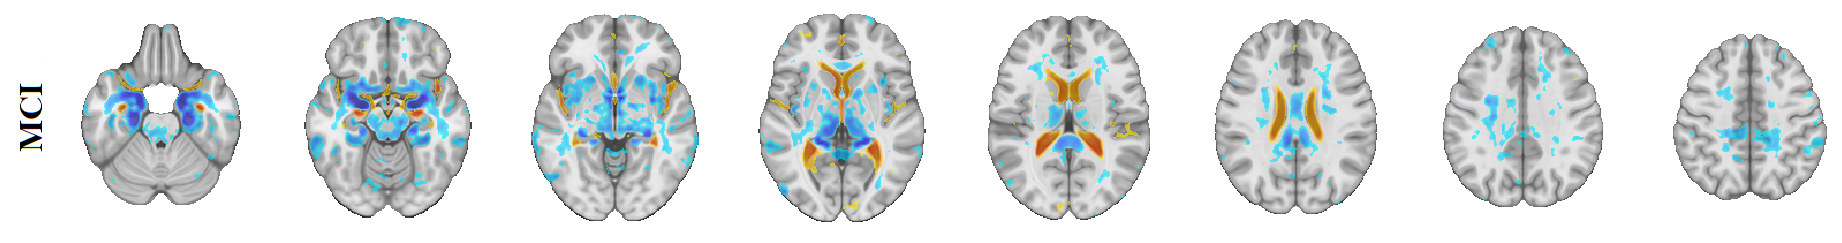
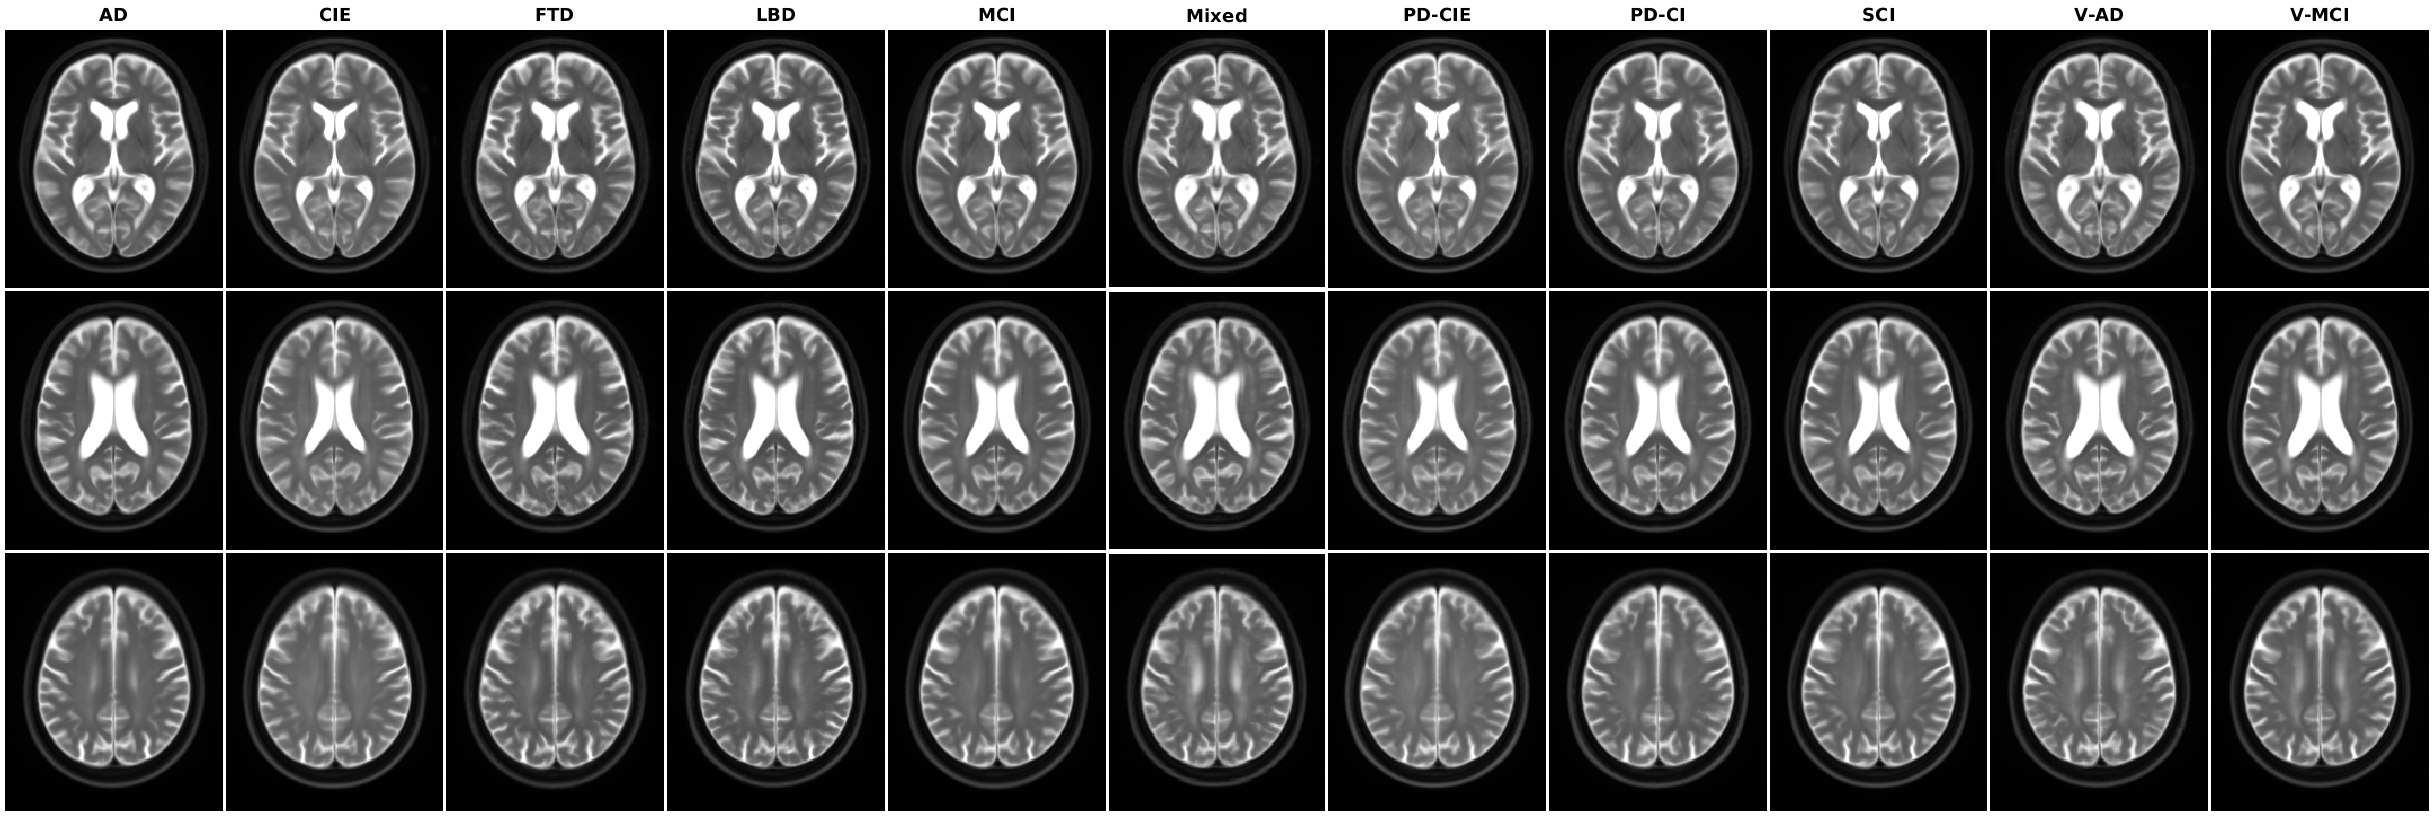
Voxel-wise distribution maps of white matter hyperintensities estimated via nonlinear registration to MNI-ICBM152 average template.